|
Step
|
Description
|
Image
|
|
1
|
-
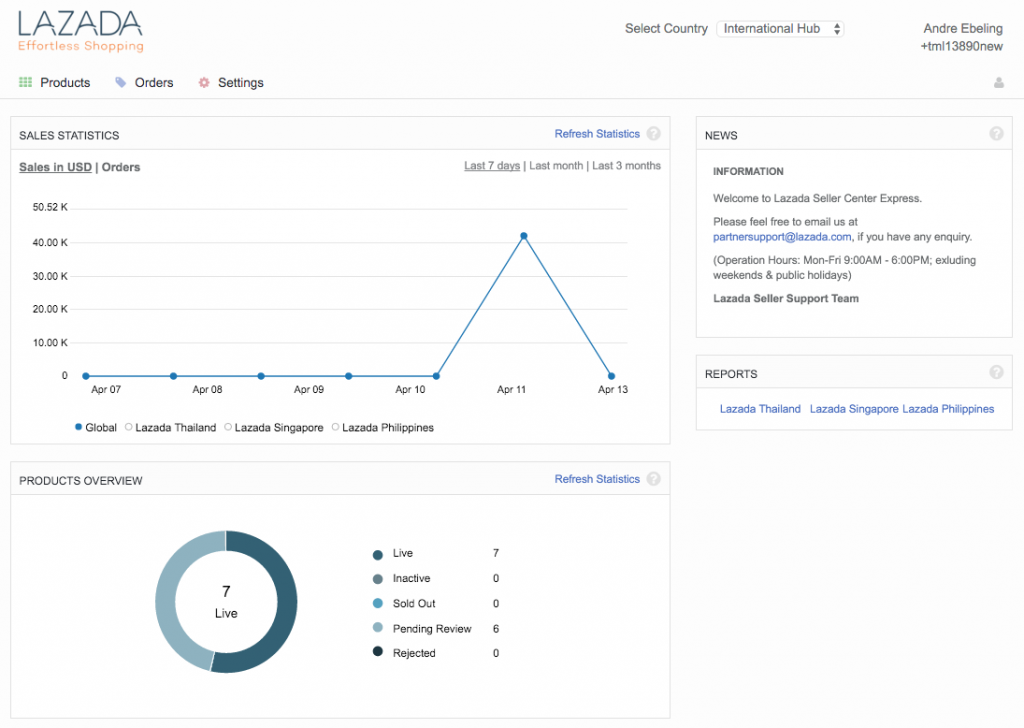
The Performance Dashboard has two different overviews:
-
Both graph can be filtered according to three time frames:
-
Last seven (7) days
-
Last month
-
Last three (3) months
-
By clicking on a country, the focus will be directed to this country and all other countries will be hidden.
|
|
|
2
|
-
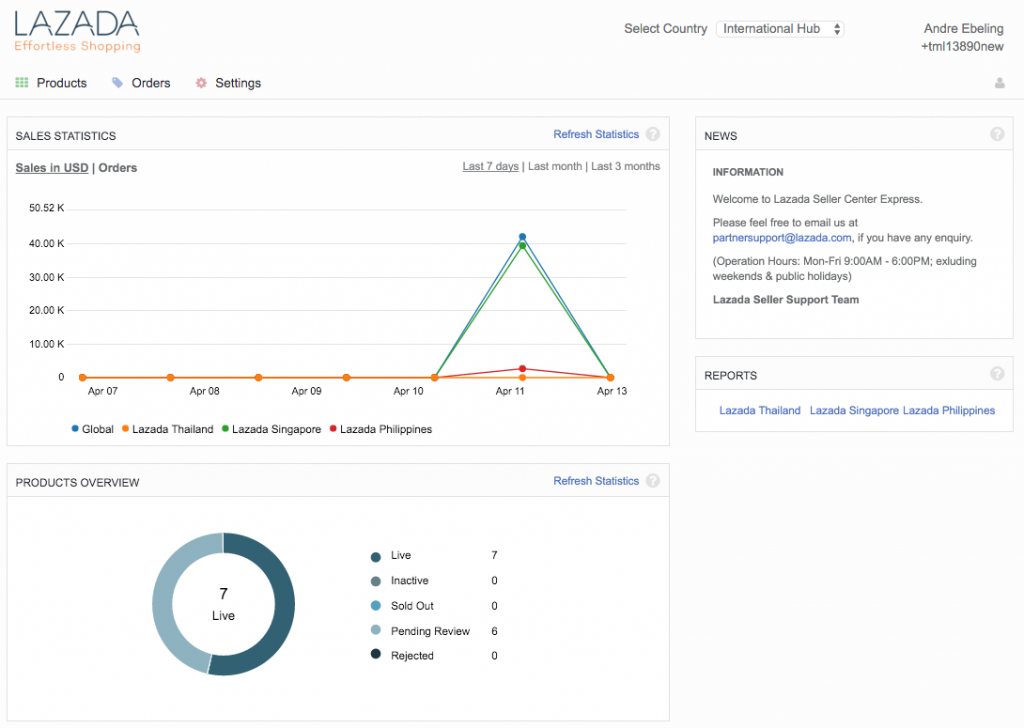
Sales graph displays to the Seller the revenues generated in each country and globally every day.
-
For a better comparison between countries, revenues are converted into USD using the latest conversion rates. Only the new orders are converted; previous ones are not updated. USD conversion is performed by a third party service (https://openexchangerates.org/).
|
|
|
3
|
-
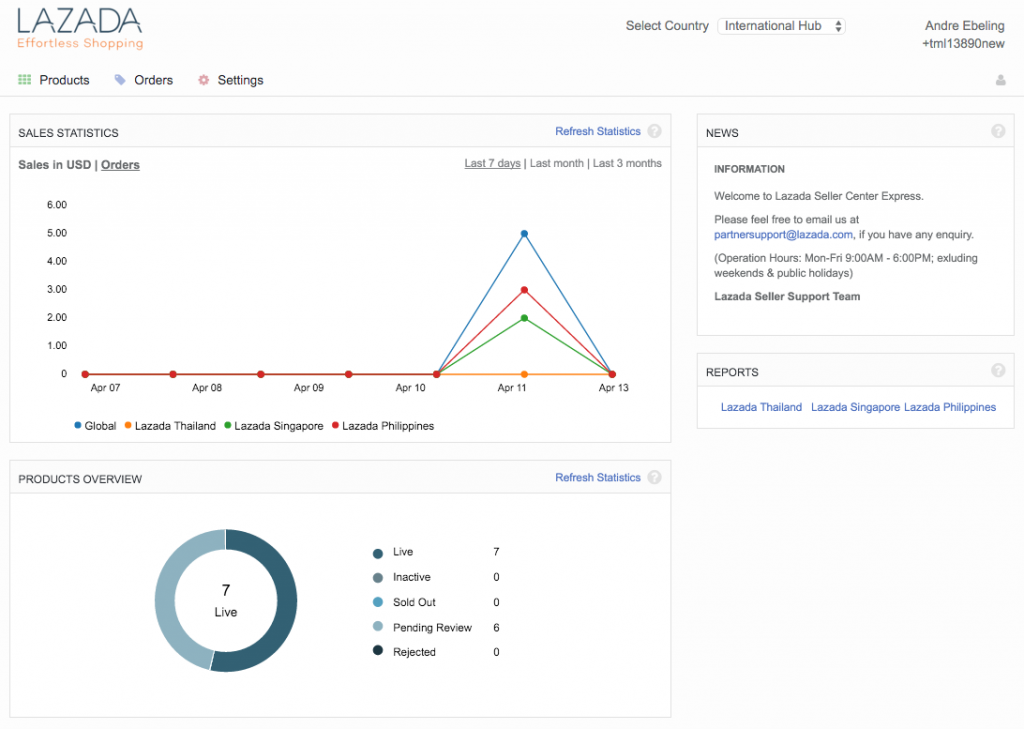
The order graph displays to the Sellers the orders received in each country and globally every day.
-
Only orders are displayed, not order items.zx
|
|


